January 2025 Newsletter Issue
Welcome to the Community Earth System Model (CESM) Newsletter. Want to receive our next newsletter in your inbox? Visit our newsletter page to subscribe and never miss a newsletter.
|
In this Newsletter:
Chief Scientist Message
EarthWorks
NSF StormSPEED Project
Updates from the MESACLIP and iPOGS Projects
visualCaseGen Tool
Searching for Photos from past CESM Workshops
Upcoming Meetings
Research Highlights from our Community
Quick Links
Chief Scientist Message

|
Dear colleagues,
Happy New Year and welcome to the January 2025 CESM Newsletter. In this Newsletter, we highlight several projects and activities that focus on modeling across scales. The EarthWorks and StormSPEED projects are building towards km-scale capabilities within the CESM framework. These and related activities will provide new research opportunities with CESM at the weather-climate interface. Additionally, the highly successful MesaCLIP project has produced an unprecedented set of high-resolution (0.25deg atm/lnd, 0.1deg ocn/ice) simulations that are leading to new understanding of the Earth System and how it may evolve going into the future. We also announce the release of the new visualCaseGen tool, a graphical user interface tool, that streamlines the creation and configuration of CESM cases. This is an important step forward in the CESM Project goals to enhance the ease-of-use of the CESM framework.
As reported in the last CESM Newsletter, the CESM Development team continues to push towards a final version of CESM3 for the CMIP7 FastTrack simulations and for release to the research community. For updates on progress and to get involved and help, I encourage people to attend the CESM Winter Working Group meetings (links for registration and to submit a presentation request are below). The status and final needs of CESM3 development will be a significant focal topic of discussion at these meetings. Finally, we announce the 30th Annual CESM Workshop and the CESM Tutorial that will take place this summer in June and July. Please mark your calendars. I look forward to seeing many of you at the AMS meeting next week. I am particularly looking forward to the Jerry Meehl symposium on Tuesday, which is a chance to honor one of CESM’s most distinguished scientists. There will also be a U.S. Climate Modeling Summit Town Hall on Monday lunchtime where there will be a discussion about the future of climate modeling and collaboration opportunities between the U.S. modeling centers.
EarthWorks
Caption
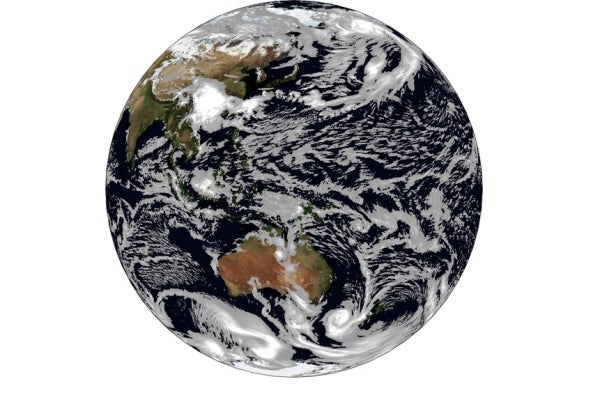
A snapshot of the condensed water simulated on a 7.5-km grid. The simulation was performed by Brian Dobbins of NSF NCAR. |
EarthWorks is a collaboration between Colorado State University (CSU) and NSF NCAR. EarthWorks has created a new, openly available configuration of CESM in which all components can be run at the same quasi-uniform resolution - up to a global storm resolving 3.75 km grid spacing. The dynamical cores of the atmosphere and ocean models are both based on the Model for Prediction Across Scales (MPAS), developed jointly by NSF NCAR and the Los Alamos National Laboratory (DoE). Performance is enhanced through the use of Graphics Processing Units (GPUs). The model is intended for both weather and climate applications. In 2024, the CESM Scientific Steering Committee agreed that EarthWorks will be officially supported as a ultra high-resolution configuration of CESM. Support for the ocean and sea ice models will be provided by CSU. All other model components will be supported by NSF NCAR. Recently, EarthWorks successfully ran the model with the target horizontal grid spacing of 3.75 km. The figure above shows a snapshot the vertically integrated condensed water from a simulation with a slightly coarser grid spacing of 7.5 km. The model configuration is available here.
Introducing the NSF StormSPEED Project
Caption
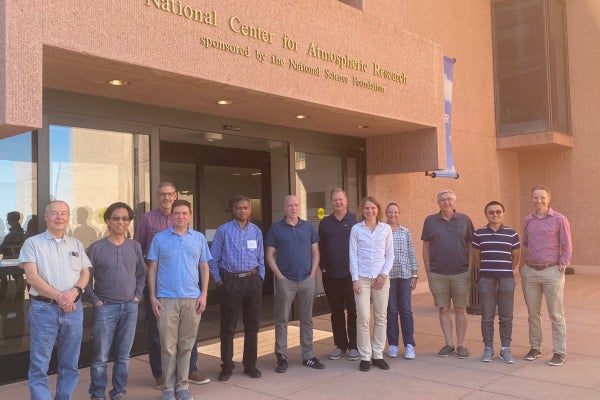
StormSPEED group photo taken at the Mesa Lab on 10/7/2024. |
NSF StormSPEED is a joint project between the University of Michigan (UM), Texas A&M University (TAMU), and NSF NCAR, with close collaboration with partners from DoE's Sandia National Laboratory and the CSU-led EarthWorks project. NSF StormSPEED provides additional capabilities for future-generation, cloud-permitting, community modeling projects with CESM. Over the project period (2024-2027) the collaborating team will (1) integrate existing nonhydrostatic (NH) version of the Spectral Element (SE) dynamical core from DoE’s E3SM model into CESM’s Community Atmosphere Model (CAM) to enable cloud-permitting coupled climate simulations, (2) advance CESM’s readiness for the newest high-performance computing architectures with Graphical Processing Units (GPUs), and (3) test and demonstrate CESM’s new scientific capabilities with the CAM-SE-NH configuration via a model hierarchy and selected scientific exemplars. The exemplars will focus on the interactions of extreme, convectively-driven precipitation over the Continental United States with the large-scale flow, and the impact of multi-scale ocean-atmosphere interactions on tropical precipitation and cyclones. This approach builds bridges between the mesoscale weather and large-scale climate communities and provides scientific insights into the impacts of mesoscale motions on the climate system. For more information, see the NSF StormSPEED website here.
Updates from the MesaCLIP and iPOGS Projects high-resolution CESM Projects
Caption
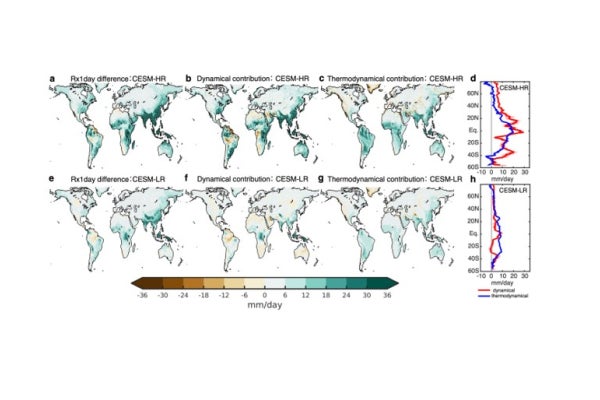
Figure. (from Chang et al. 2025) (a) Future changes in Rx1day (mm/day) over global land averaged over 2071-2100, relative to the 1981-2010 period, in CESM-HR. Future Rx1 day changes driven by dynamical (b) and thermodynamical (c) tendencies in CESM-HR. (d) Zonally averaged Rx1day changes driven dynamical (red) and thermodynamical (blue) tendencies across global land in CESM-HR. Shading represents standard deviation across ensemble members. (e-h) As in (a-d) but for CESM-LR. Stippling indicates regions where three-quarters of the ensemble members agree on the sign of the ensemble mean. |
A team of researchers consisting of scientists at the Texas A&M University (TAMU) and NSF NCAR has made major breakthroughs in advancing high-resolution global climate modeling and predictions. This effort is primarily funded by the NSF under a project entitled “understanding the role of MESoscale Atmosphere-ocean interactions in seasonal-to-decadal CLImate Prediction (MESACLIP)” We also acknowledge support from the Gulf Research Program of the U.S. National Academies of Sciences, Engineering, and Medicine through a project entitled “Improving Prediction and projection of Gulf of Mexico Sea-level changes using eddy-resolving Earth system models (iPOGS)”.
An unprecedented set of simulations have been performed at a tropical cyclone-permitting and ocean-eddy-rich resolution using an earlier version of the Community Earth System Model (CESM 1.3), with many additional modifications and improvements (hereafter simply referred to as CESM-HR). CESM-HR uses a 0.25° grid in the atmosphere and land and a 0.1° grid in the ocean and sea-ice components. Expanding upon CESM-HR simulations that started as an international collaboration in 2018 (Chang et al. 2020), the full set of simulations include: a 500-year pre-industrial control simulation; a 10-member ensemble of historical simulations; 10-member ensembles each of RCP8.5 and RCP6.0 future scenario simulations; 1 member each RCP4.5 and RCP2.6 future scenario simulations; all HighResMIP coupled and AMIP simulations; and 10-member ensembles of 5-year decadal prediction simulations for the 1980-2023 period with May and November start dates for each year. These high-resolution simulations offer promising potential to reduce model biases and uncertainties in comparison to their low-resolution counter parts (CESM-LR; nominal 1° resolution), improving our understanding of key processes. The MESACLIP and iPOGS team is excited to announce that the datasets from select simulations, including the 10-member ensembles of historical and future scenario simulations, are now available to the community through the NSF NCAR Research Data Archive (RDA) via the MESACLIP and iPOGS websites.
CESM-HR simulations significantly boost confidence in projections of future extreme precipitation changes. In a recent study, Chang et al. (2025) show striking improvements in CESM-HR over CESM-LR when comparing simulated and observed extreme precipitation using annual maximum daily precipitation (Rx1day) for the historical period. They then compare Rx1day projections for the late 21st century (2071-2100) under RCP8.5 relative to recent decades (1981-2010) (Fig. a and e). Both CESM-HR and CESM-LR project increased Rx1day across regions with intense extreme precipitation, but CESM-HR shows a much larger increase, with a global land-averaged Rx1day increase of 11.1 mm/day, ~90% greater than CESM-LR’s 5.9 mm/day increase. Regional differences are even more striking: CESM-HR projects increases exceeding 30 mm/day in parts of the classic monsoon region, five times the 6 mm/day increase projected by CESM-LR. Over the contiguous United States (CONUS), CESM-LR projects a 6 mm/day increase for both the West Coast and Southeast, while CESM-HR projects a similar increase for the West Coast but nearly triples it for the Southeast, reaching over 18 mm/day. CESM-HR’s sharper Rx1day increase from midlatitudes to subtropics and tropics aligns with its improved representation of mesoscale convective systems, which drive extreme precipitation but are underrepresented in CESM-LR.
A moisture budget analysis highlights key differences in drivers of future extreme precipitation. In CESM-HR, dynamical tendency dominates over thermodynamical tendency across most regions of intense extreme precipitation (Fig. b and c), suggesting that future intensifications arise from both moisture and circulation changes. In contrast, CESM-LR attributes Rx1day increases primarily to thermodynamical effects globally, except in the tropics where dynamical effects also contribute (Fig. f and g), implying that CESM-LR projects extreme precipitation increases mainly from enhanced atmospheric moisture in a warmer climate, consistent with findings from previous low-resolution models. These differences are further illustrated by zonally averaged dynamical and thermodynamical contributions (See Figure above, d and h).
Project Members: Ping Chang (TAMU), Gokhan Danabasoglu (NSF NCAR), Fred Castruccio (NSF NCAR), Dan Fu (TAMU), Teagan King (NSF NCAR), Xue Liu (TAMU), Greta Olson (TAMU), Nan Rosenbloom (NSF NCAR), Justin Small (NSF NCAR), Xiaoqi Wang (TAMU), Gaopeng Xu (TAMU), Steve Yeager (NSF NCAR), Qiuying Zhang (TAMU)
References
Chang, P., S. Zhang, G. Danabasoglu, S. G. Yeager, H. Fu, H. Wang, F. Castruccio, Y. Chen, J. Edwards, D. Fu, Y. Jia, L. C. Laurindo, X. Liu, N. Rosenbloom, R. J. Small, G. Xu, Y. Zeng, Q. Zhang, J. Bacmeister, D. A. Bailey, X. Duan, A. K. DuVivier, D. Li, Y. Li, R. Neale, A. Stössel, L. Wang, Y. Zhuang, A. Baker, S. Bates, J. Dennis, X. Diao, B. Gan, A. Gopal, D. Jia, Z. Jing, X. Ma, R. Saravanan, W. G. Strand, J. Tao, H. Yang, X. Wang, Z. Wei, and L. Wu, 2020: An unprecedented set of high-resolution Earth system simulations for understanding multiscale interactions in climate variability and change. J. Adv. Model. Earth Sys., 12, e2020MS002298, doi: 10.1029/2020MS002298.
Chang, P., D. Fu, X. Liu, F. Castruccio, A. F. Prein, G. Danabasoglu, X. Wang, J. Bacmeister, Q. Zhang, N. Rosenbloom, and S. Bates, 2025: Amplified future extreme precipitation risks projected by high-resolution climate models. Nat. Clim. Change (submitted).
visualCaseGen Tool
|
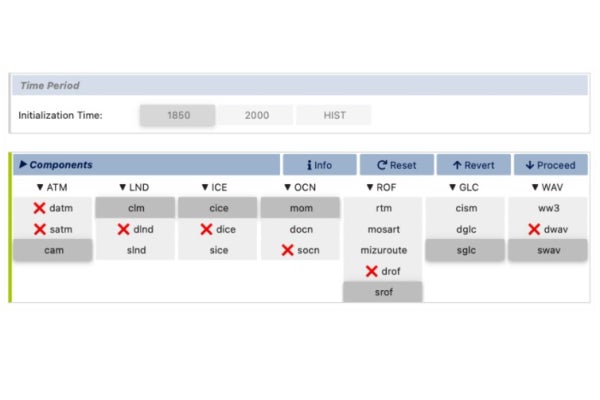
We are pleased to announce the release of the visualCaseGen tool. This is a Jupyter-based graphical user interface (GUI) that can be used to streamline the creation and configuration of CESM cases (tag cesm3_0_beta08 and later). It can be used to browse standard CESM configurations and easily select from available CESM compsets and resolutions and it also greatly simplifies the setup of user-defined custom configurations. For example, this tool can guide you through the setup of a world with your own idealized ocean bathymetry, continental geometry, and land surface properties. Check out this video tutorial that demonstrates how visualCaseGen can be used. We also encourage users to explore this new tool following the documentation here and to open issues on the visualCaseGen GitHub repository if problems arise. The development of this tool has been made possible by NSF OAC Elements award number 2004575 and was led by Alper Altuntas with contributions from Sam Levis, Brian Dobbins, Isla Simpson, Scott Bachman, Gokhan Danabasoglu, Bill Sacks, Erik Kluzek, and Mariana Vertenstein.
Searching for photos from past CESM Workshops
Caption
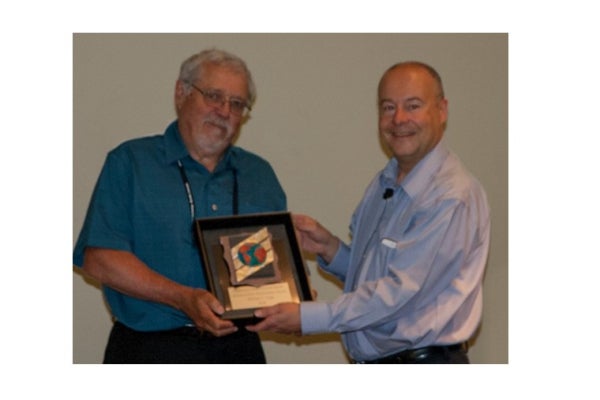
Bill Large receiving the CESM Distinguished Achievement Award from past CESM chief scientist Gokhan Danabasoglu in 2018. |
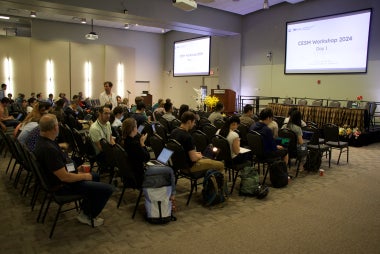
The CGD Admin team is searching for photos from past CESM Workshops for potential display at the forthcoming 30th Annual CESM Workshop (see below). If you have any photos, please submit them to this Google form. Any submission is greatly appreciated.
Upcoming Meetings
|
2025 CESM Winter Working Group Meetings
The 2025 CESM Winter Working Group Meetings will take place from January 28th to March 7th, 2025. The schedule can be found below:
Land Ice Working Group Meeting: Tuesday, January 28th
Paleoclimate Working Group Meeting: Wednesday, January 29th
Software Engineering Working Group Meeting: Thursday, January 30th
Atmosphere Model, Chemistry Climate, Whole Atmosphere, Earth System Prediction and Climate Variability and Change Working Group Meeting: February 3rd to 6th
Land Model and Biogeochemistry Working Group Meeting: February 24th to 26th
Ocean Model Working Group: February 27th to 28th
Polar Climate Working Group: March 3rd to 6th
More information can be found on the logistics tab of our webpage.
Save the Date: The 30th Annual CESM Workshop

|
Join us, in person or online, for the 30th Annual CESM Workshop. June 9-11, 2025, Boulder CO. Details and links for lodging can be found online. The call for talks and workshop registration will open soon.
The CESM Tutorial
The CESM Tutorial will take place from July 7 to July 11, 2025, in Boulder, CO. More information and the application can be found here.
The tutorial will consist of lectures on simulating the climate system, practical sessions on running CESM, modifying components, and analyzing data, small group discussions with CESM scientists, and student networking.
The CESM tutorial is targeted to individuals with no or little experience with CESM. It provides attendees with a solid scientific understanding of the CESM components and the basic building blocks to start running the model. We welcome applications from students, postdocs, research scientists, and faculty members, especially from individuals whose research/career would benefit from using CESM.
The deadline to apply is Monday, February 3, 2025, at 11:59 PM Mountain Time. Decisions will be made by April 18, 2025.
Research Highlights from Our Community
Caption
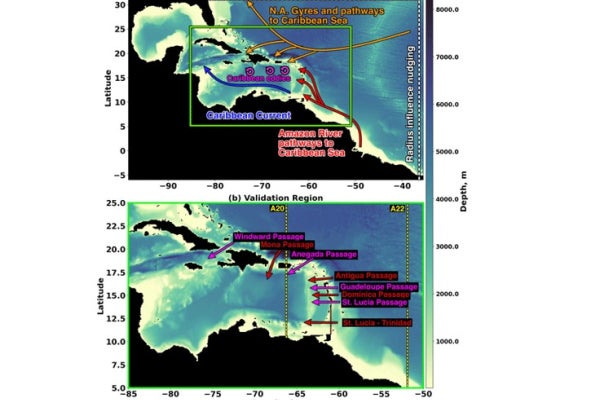
Figure 1: Model domain and topography from CARIB12 |
CARIB12: A Regional Community Earth System Model / Modular Ocean Model 6 Configuration of the Caribbean Sea
Giovanni G. Seijo-Ellisa, Donata Giglio, Gustavo M. Marques, and Frank O. Bryan
A new CESM/MOM6 ocean-only regional 1/12° configuration of the Caribbean Sea is presented and validated. The model configuration was developed as a response to the rising need of high-resolution models for climate impact applications. The configuration is validated for the period covering 2000–2020 against ocean reanalysis and a suite of observation-based datasets. Particular emphasis is paid to the configuration's ability to represent the dynamical regime and properties of the region across sub-seasonal, seasonal and inter-annual timescales. Near-surface fields of temperature, salinity and sea-surface height are well represented. In particular the seasonal cycle of sea-surface salinity and the spatial pattern of the low salinity associated with the Amazon and Orinoco river plumes is well captured. Surface speeds compare favorably against reanalysis and show the mean flows within the Caribbean Sea are well represented. We performed a case study to examine the origin of waters arriving to the Virgin Islands Basin and show the model reproduces known pathways and timing for river plume waters intruding the region. The seasonal cycle of the mixed layer depth is also well represented with biases of less than 3 m when comparing to ocean reanalysis. The vertical structure and stratification across the water column is represented favorably against ship-based observations with the largest simulated biases in the near-surface water mass and the sub-surface salinity maximum associated with the sub-tropical underwater mass. The temperature and salinity variability of the vertical structure is well represented in the model solution. We show that mean ocean mass transports across the multiple passages in the eastern Caribbean Sea compare favorably to observation-based estimates, but the model exhibits smaller variability compared to ocean reanalysis transport estimates. Furthermore, a brief comparison against a 1° CESM global ocean configuration shows that the higher resolution regional model improves significant biases in sea-surface salinity and mixed layer depth in particular. Additionally, the regional model better represents important features and variability within the Caribbean Sea compared to the 1° model. Overall, the regional model reproduces to a good degree the processes within the Caribbean Sea and opens the possibility of regional ocean climate studies in support of decision-making within CESM.
Predictability of Tropical Pacific Decadal Variability is Dominated by Oceanic Rossby Waves
Xian Wu, Stephen G. Yeager, Clara Deser, Antonietta Capotondi, Andrew T. Wittenberg & Michael J. McPhaden
Despite its pronounced global impacts, tropical Pacific decadal variability (TPDV) is poorly predicted by current climate models due to model deficiencies and a limited understanding of its underlying mechanisms. Using observational data and a hierarchy of model simulations including decadal hindcasts, we find that decadal isopycnal depth variability driven by oceanic Rossby waves in the tropical Pacific provides the most important source of predictability for TPDV. The predictability arising from initial isopycnal depth conditions is further amplified by tropical ocean-atmosphere coupling and variations in the strength of subtropical cells in the Pacific throughout the decadal forecasts. Regional initialization experiments that effectively isolate the impact of different ocean basins on TPDV predictability highlight the essential role of the tropical Pacific. This study enhances our understanding of the mechanisms governing TPDV predictability, offering crucial insights for improving the accuracy of decadal predictions.
When is a trend meaningful? Insights to carbon cycle variability from an initial-condition large ensemble
Bonan, G. B., Deser, C., Wieder, W. R., Lombardozzi, D. L., and Lehner, F.
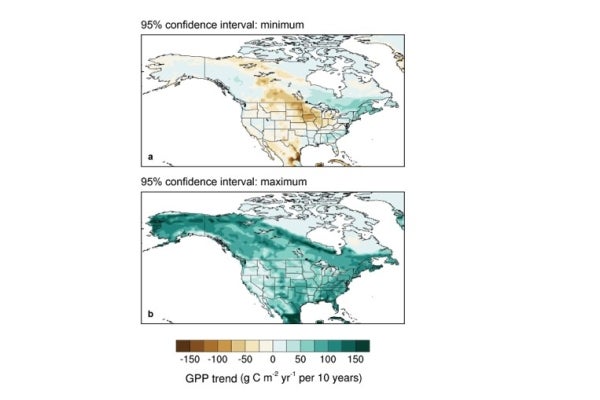
Evidence for a changing biosphere is obtained from the worldwide network of eddy covariance flux towers, which measure energy, water, and CO 2 exchange between the biosphere and atmosphere. Analyses of flux tower measurements find temporal increases in terrestrial productivity at many locations, but the extent to which internal climate variability influences carbon cycle trends is unknown. We used the CESM2 initial-condition large ensemble to show that internal variability produces a range of outcomes in the terrestrial carbon cycle. Trends in gross primary production (GPP) from 1991–2020 differ among ensemble members due to the different climate trajectories resulting from internal variability. We quantified how internal climate variability imparts on GPP trends and applied our methodology to the observational record. Observed changes in GPP at two long-running eddy covariance flux towers are consistent with internal variability, challenging the understanding of forced changes in the carbon cycle at these locations. A probabilistic framework that accounts for internal variability is needed to interpret carbon cycle trends.
Caption
95% confidence interval in annual GPP trends for 1991–2020. Shown are the (a) low and (b) high values for the 95% confidence interval obtained from the large ensemble. GPP trends range from negative to positive in some regions, most prominently in the Canadian prairie extending into Midwest US. In other regions, the 95% confidence interval spans a range from small to large positive trends. |
Quick Links
CGD X Account
CGD Youtube Channel
CGD Instagram
CGD LinkedIn
CESM User Support Forum
CVCWG Simulations
Simpler Models Information
Thanks for reading this CESM Newsletter! Expect to see the next one in the Spring of 2025. Please send potential Newsletter items to Elizabeth Faircloth.

